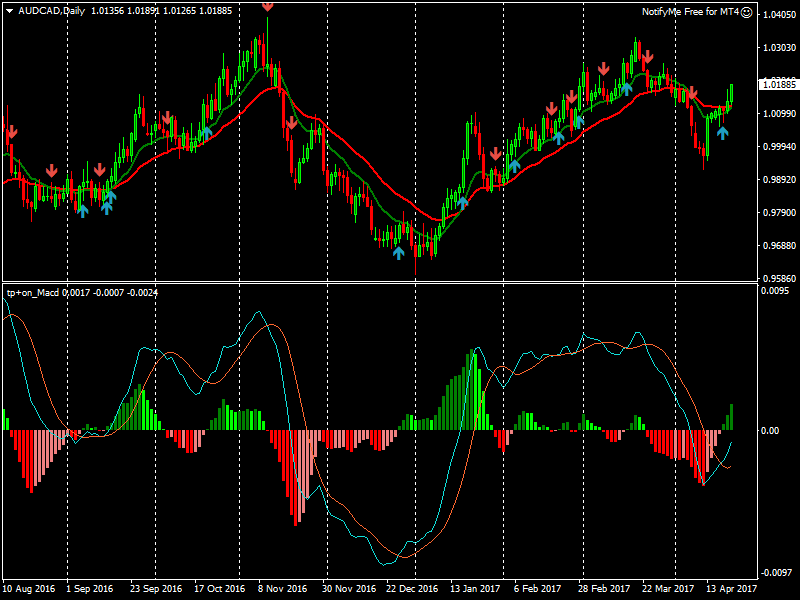
This article will be about the MACD indicator and how it is created. When using any indicator or trading system we need to understand both the how and the why of how the system is created or we leave ourselves vulnerable to misinterpreting the information we are attempting to acquire. The first and most important point with using the MACD as an indicator for currency trading is realizing that the template MACD That comes with most trading platforms is a modified version that has been scaled differently then the more traditionally thought of version. In the Metatrader template version the MACD Line has been removed and the indicator is scaled slightly different. For the purpose of this article we will focus on the more traditional version. Traditional is a relative word here since the indicator i have downloaded in the trading marketplace, while having more traditional setups in the indicator window, also possesses signal arrows that appear in the charting window. For the purpose of this exercise we don’t care about this part of indicator so we will disregard those signal arrows. There are many free versions you can download for your chart marketplace and most are based on the principals we will discuss below.
The MACD Indicator is generally considered a lagging indicator and the 3 components that make up the indicator all have a set relationship to each other. While in itself a lagging indicator there are various ways of reading the MACD To use it more as a leading indicator which we wont discuss here.
Part 1: The MACD Line
The MACD line is a plotted line through the indicator window made up as the difference between a 12 period EMA and a 26 period EMA that would be plotted through our regular charting window. When the fast line is above the slow line, the difference between the two lines is plotted in the indicator window above the zero line in the middle. So for example if the fast line is five pips above the slow line then 5 pips would be plotted for the MACD Line above the zero line. As long as the fast line is above the slow line the the closing difference will continue to be plotted above zero for the MACD Line. When a crossover happens between the slow line and the fast line the MACD Line will cross the zero line in the indicator window. So to continue or previous example if the slow line crosses above the fast line and closes the period with a difference of 5 pips then the MACD Line will be plotted at 5 pips below the zero line in our indicator window.The MACD Line will then continue to be plotted below the zero line until there is a crossover between the fast and slow EMA’s again and then the MACD Line will then move once again above zero.
Part 2: The Signal line
The signal line will be second line in our indicator window. It will be smoother and lag behind the MACD line. This is because the signal line is actually a 9 period EMA of our MACD line. So in the same way we would create an EMA in our regular chart, add together the desired number of periods and average them with the most recent periods weighed more heavily, we would do this to create our signal line. We can see how the signal line is smoother version of our MACD Line as the line has been created to clean up the volatility of our MACD Line.
Part 3: The Histogram
The histogram is the bars that run through the middle of our indicator window. It is plotted by taking the difference between the MACD line and the Signal line and plotting them in a way that changes how we visualize the difference. When the MACD Line, now a fast line, is above the signal line, now a slow line, the histogram will be above zero to show this. It will be scaled so the top of the bar will show the amount of pips between the lines on the right end of the indicator window. When the Signal line is above the MACD line the bars will be below the zero line. Once again it will be scaled to show the specific value in pips between the lines. When a crossover between the MACD LIne and the Signal line takes place the bars will also switch from being above or below the zero line. The video below gives a more visual description to go along with this article.

